2013 Perseid Report

[et_pb_section bb_built="1"][et_pb_row][et_pb_column type="2_3"][et_pb_text _builder_version="3.9"]

perseid_2013_ks1

[/et_pb_text][/et_pb_column][et_pb_column type="1_3"][et_pb_text _builder_version="3.9"]

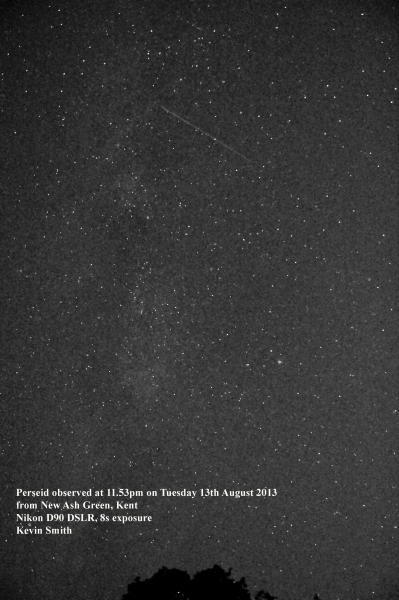
What is astonishing about this image is that in 8 seconds Kevin has also captured the Milkyway which in his neck of the woods is washed out with light pollution.

[/et_pb_text][/et_pb_column][/et_pb_row][et_pb_row][et_pb_column type="1_3"][et_pb_text _builder_version="3.9"]

perseid2013-sd1

[/et_pb_text][/et_pb_column][et_pb_column type="2_3"][et_pb_text _builder_version="3.9"]

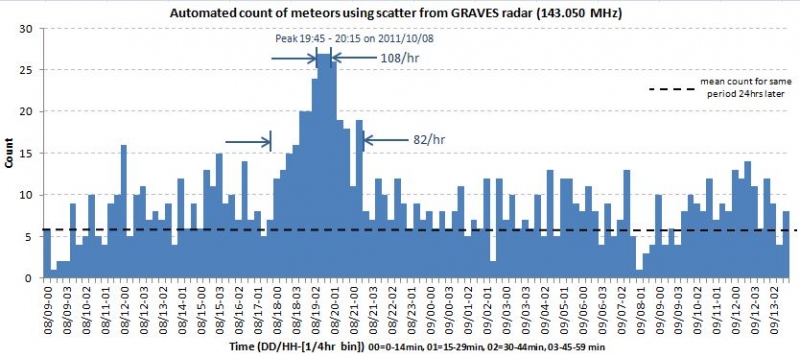
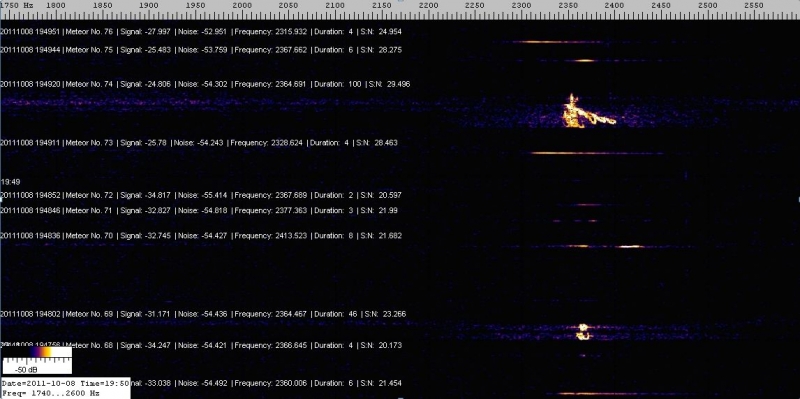
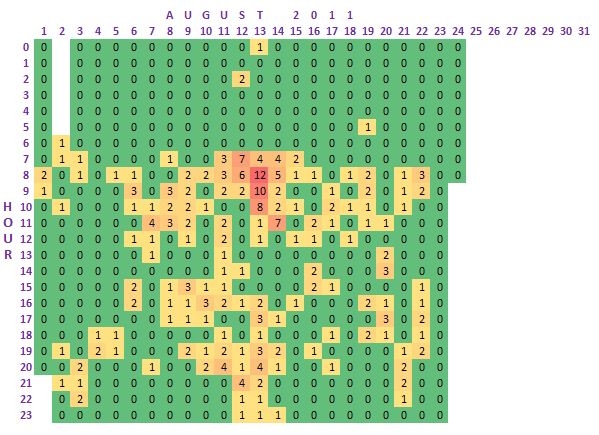
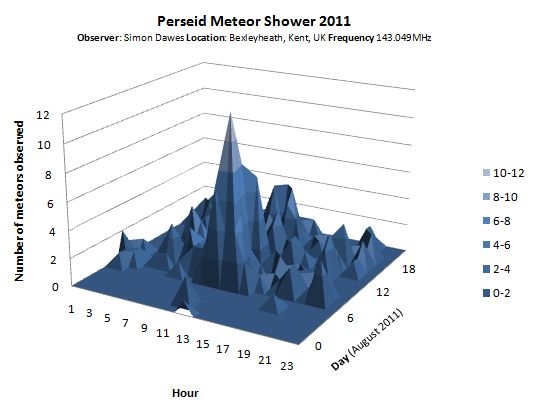
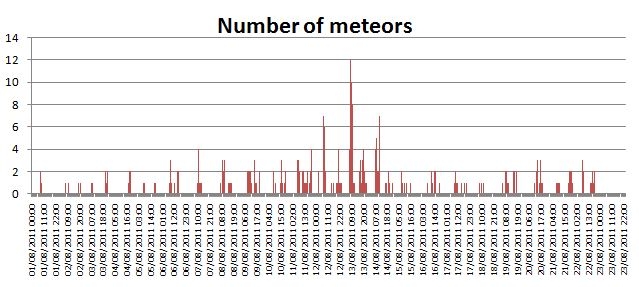
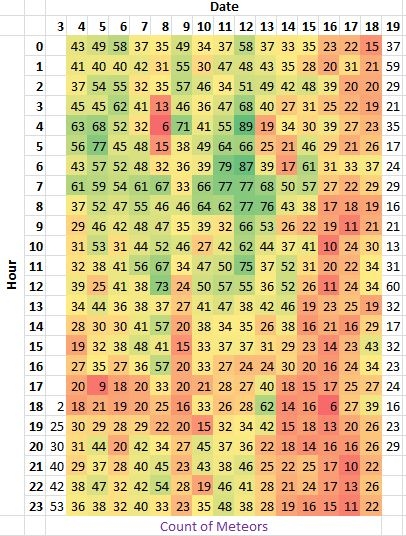
Simon Dawes left his automated radio meteor observations to do the work and checked up later in August  
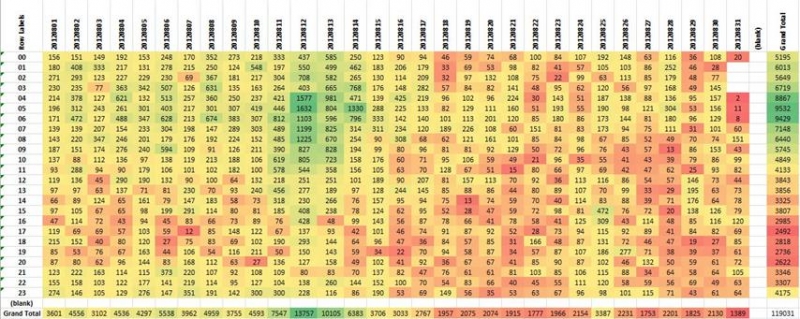
Like last year the morning of the 12th showed the most meteors.

[/et_pb_text][/et_pb_column][/et_pb_row][et_pb_row][et_pb_column type="1_3"][et_pb_text _builder_version="3.9"]

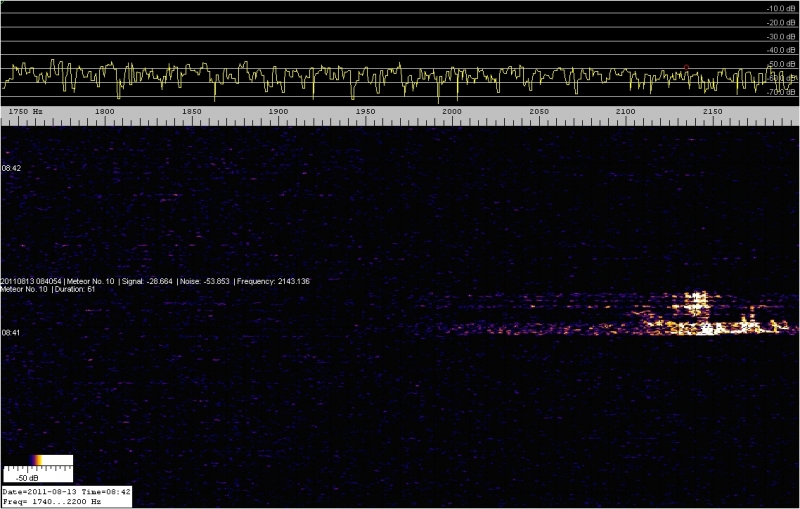
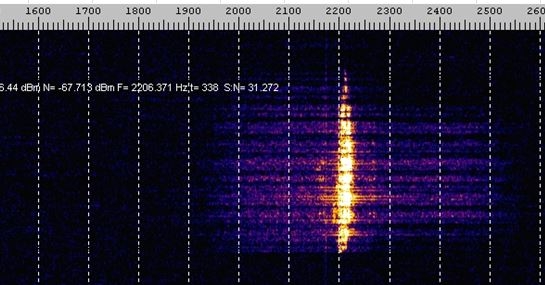
This was the highest duration meteor captured on the 12th August 2013 at 11:38:18 it lasted for 338 counts which looking at the trace is about a minute.

[/et_pb_text][/et_pb_column][et_pb_column type="2_3"][et_pb_text _builder_version="3.9"]

perseid2013-sd2

[/et_pb_text][/et_pb_column][/et_pb_row][/et_pb_section]

2012 Perseid Report

[et_pb_section bb_built="1"][et_pb_row][et_pb_column type="4_4"][et_pb_text _builder_version="3.9"]

Report by Simon Dawes

On holiday in Austria, clouded out, however my automated radio meteor observations continued to run 24hrs per day while I was away, this year was more successful than last, primarily due to the Yagi now being mounted on a mast.
Frequency 143.049 MHz
Equipment 4 Element Yagi, Yupiteru MVT7100 receiver, Spectrum Lab software

[/et_pb_text][et_pb_text _builder_version="3.9"]

Radiocolourgramperseid2012

ColourGram of total Meteor durations, hours are down the page days across the page, represents all of August 2012

[/et_pb_text][et_pb_text _builder_version="3.9"]

perseid_201208120459waterfall

Waterfall diagram from Spectrum Lab showing some of the Perseid meteors

[/et_pb_text][et_pb_text _builder_version="3.9"]

Looking at the waterfall traces my system automatically saves there was a significant number of large long duration traces during the Perseids. For those not familiar with waterfall diagrams, time is on the vertical axis (present at the top past at the bottom) and frequency on the horizontal axis, the colour represents the signal strength at that frequency. a 'wide' plot indicates a dopler-shift of the radar (GRAVES) that I am monitoring which is normally not 'visible' from my location. The thin vertical line is noise (a real pain in the ....) The meteor in the middle of the trace at 04:58 and 09s is a more usual meteor, very short duration (in this case 4 clock counts) but yo can see the other meteors last much longer (the ionisation path reflecting the radar lasts longer in the atmosphere)

perseid_2012-durationanalysis

Analysing the meteor durations and putting into bins it was able to show a much sharper peak when only meteors greater than 8 counts were included

[/et_pb_text][/et_pb_column][/et_pb_row][/et_pb_section]

2011 Draconids Report

[et_pb_section bb_built="1"][et_pb_row][et_pb_column type="4_4"][et_pb_text _builder_version="3.9"]

Draconids

The Draconids, also known as the Giacobinids, after the parent comet, are a variable meteor shower, the parent body being comet 21P/Giacobini-Zinner, occasionally the Earth passes through denser clumps of material from 21P/Giacobini-Zinner and these have produced significant meteors.

Previous meteor activity
Year
observed ZHR / comments

1933 STORM
"I counted 200 meteors in two minutes, and then counting became impossible. The fire-stars became as thick as the flakes of a snowstorm. Instead of twos and threes they came in flocks and gusts. The sky was thick with them wherever one looked." Rev. W. F. A. Ellison (Former Director of Armagh Observatory); Belfast Telegraph on Wednesday, October 11, 1933

1946 STORM
+10000/hr
1953 Outburst
250/hr
1985 Outburst
550/hr
1998 Outburst
500/Hr
2011
60 to 600 predicted

2011 Observations

Members of Crayford Manor House Astronomical Society observed this event from the UK and Turkey, visual observations from the UK were hampered by cloud and the only successful results from the UK by members of the society were from radio observations.

The chart below shows the automated meteor count showing the peak from 19:45 - 20:15 on the 8th October 2011, the sporadic rate is ~24 per hour.

[/et_pb_text][et_pb_text _builder_version="3.9"]

Chart showing the results of automated radio observations from Simon Dawes.

draconids2011autoountchart

[/et_pb_text][et_pb_text _builder_version="3.9"]

waterfalldraconidspeak2011

This screen shot shows time (past at the bottom of the page, present at the top of the page) and the power of the signal at different frequencies, on the receiver these manifest themselves as whistles - see below.

This recording contains numerous meteors, the largest and longest at around 53s

[/et_pb_text][/et_pb_column][/et_pb_row][/et_pb_section]

2011 Perseid Report

[et_pb_section bb_built="1"][et_pb_row][et_pb_column type="4_4"][et_pb_text admin_label="intro Text" _builder_version="3.9"]

This year was a challenging year for observing, the moon was full and most of the country was cloudy.

Clouded out for visual observations Simon Dawes was on holiday on Guernsey but his automated radio meteor logging station in Bexleyheath, Kent, England, did observe the Perseid's, the peak was between 08:00 - 09:00 UT on the 13th August.

Experimental automated meteor observing set-up

Frequency 143.049 MHz
Equipment 4 Element Yagi, Yupiteru MVT7100 receiver, Spectrum Lab software

[/et_pb_text][/et_pb_column][/et_pb_row][et_pb_row][et_pb_column type="2_3"][et_pb_text _builder_version="3.9"]

Radio_Perseids_2011_colorgram

[/et_pb_text][/et_pb_column][et_pb_column type="1_3"][et_pb_text _builder_version="3.9"]

This plot is called a Colourgram, it plots time of day against day of month the figures are the number of meteors observed.

[/et_pb_text][/et_pb_column][/et_pb_row][et_pb_row][et_pb_column type="2_3"][et_pb_text _builder_version="3.9"]

Radio_Perseids_2011_surfaceplot

[/et_pb_text][/et_pb_column][et_pb_column type="1_3"][et_pb_text _builder_version="3.9"]

A 3D surface plot of the Perseid meteor shower in 2011.
This plots time in one axis with day of month on the other, the height of the peaks indicate the number of meteors observed.

[/et_pb_text][/et_pb_column][/et_pb_row][et_pb_row][et_pb_column type="2_3"][et_pb_text _builder_version="3.9"]

Radio_Perseids_2011_plot

[/et_pb_text][/et_pb_column][et_pb_column type="1_3"][et_pb_text _builder_version="3.9"]

Radio observations of the Perseid meteor shower, counts plotted in 1 hour buckets

[/et_pb_text][/et_pb_column][/et_pb_row][et_pb_row][et_pb_column type="2_3"][et_pb_text _builder_version="3.9"]

Meteor20110813084054

[/et_pb_text][/et_pb_column][et_pb_column type="1_3"][et_pb_text _builder_version="3.9"]

This plot shows a waterfall diagram of a Perseid fireball, the signal was received for 12.2s! frequency is plotted horizontally and time vertically with the top of the chart being the present and the bottom of the chart representing the 2 minutes earlier

[/et_pb_text][/et_pb_column][/et_pb_row][/et_pb_section]

TOP
Protected by CleanTalk Anti-Spam