Report by Simon Dawes
On holiday in Austria, clouded out, however my automated radio meteor observations continued to run 24hrs per day while I was away, this year was more successful than last, primarily due to the Yagi now being mounted on a mast.
Frequency 143.049 MHz
Equipment 4 Element Yagi, Yupiteru MVT7100 receiver, Spectrum Lab software
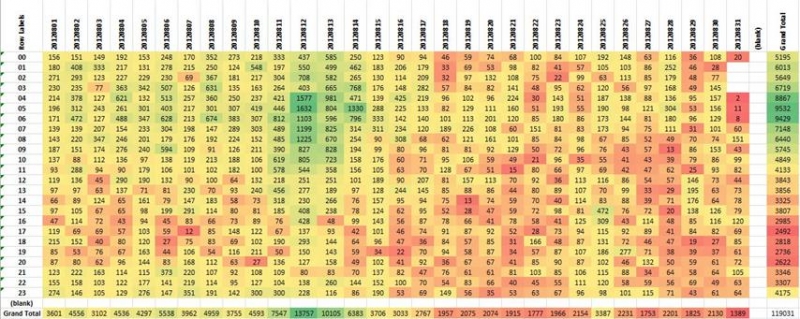
ColourGram of total Meteor durations, hours are down the page days across the page, represents all of August 2012
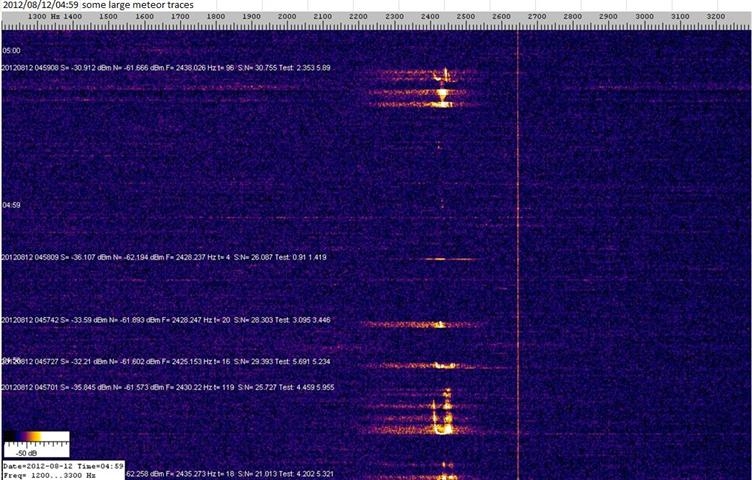
Waterfall diagram from Spectrum Lab showing some of the Perseid meteors
Looking at the waterfall traces my system automatically saves there was a significant number of large long duration traces during the Perseids. For those not familiar with waterfall diagrams, time is on the vertical axis (present at the top past at the bottom) and frequency on the horizontal axis, the colour represents the signal strength at that frequency. a ‘wide’ plot indicates a dopler-shift of the radar (GRAVES) that I am monitoring which is normally not ‘visible’ from my location. The thin vertical line is noise (a real pain in the ….) The meteor in the middle of the trace at 04:58 and 09s is a more usual meteor, very short duration (in this case 4 clock counts) but yo can see the other meteors last much longer (the ionisation path reflecting the radar lasts longer in the atmosphere)
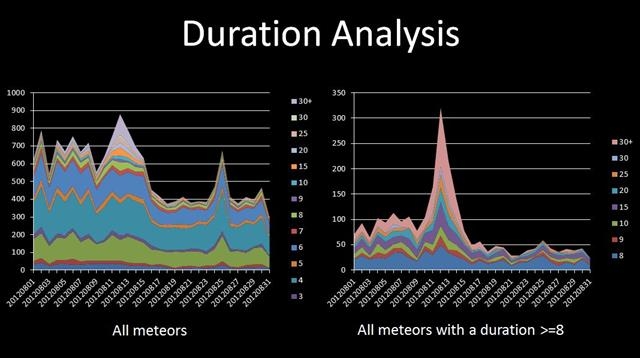
Analysing the meteor durations and putting into bins it was able to show a much sharper peak when only meteors greater than 8 counts were included