This year was a challenging year for observing, the moon was full and most of the country was cloudy.
Clouded out for visual observations Simon Dawes was on holiday on Guernsey but his automated radio meteor logging station in Bexleyheath, Kent, England, did observe the Perseid’s, the peak was between 08:00 – 09:00 UT on the 13th August.
Experimental automated meteor observing set-up
Frequency 143.049 MHz
Equipment 4 Element Yagi, Yupiteru MVT7100 receiver, Spectrum Lab software
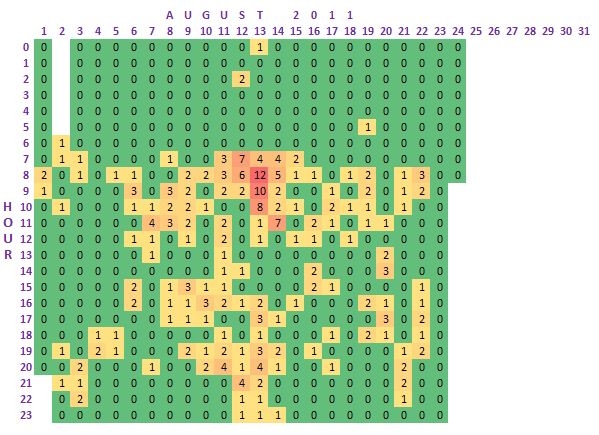
This plot is called a Colourgram, it plots time of day against day of month the figures are the number of meteors observed.
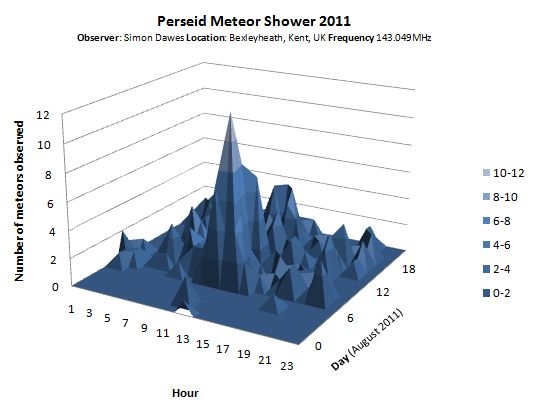
A 3D surface plot of the Perseid meteor shower in 2011.
This plots time in one axis with day of month on the other, the height of the peaks indicate the number of meteors observed.
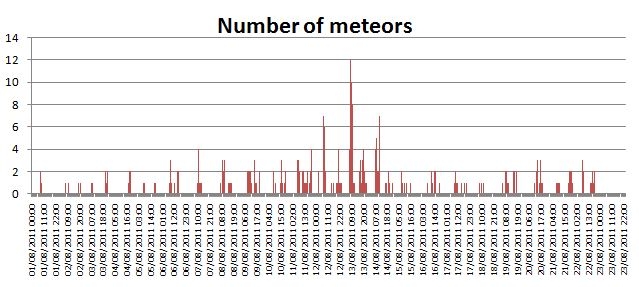
Radio observations of the Perseid meteor shower, counts plotted in 1 hour buckets
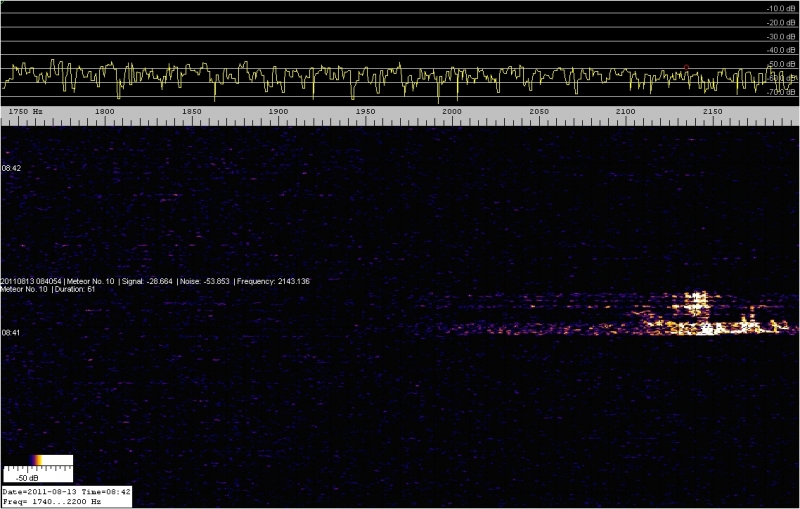
This plot shows a waterfall diagram of a Perseid fireball, the signal was received for 12.2s! frequency is plotted horizontally and time vertically with the top of the chart being the present and the bottom of the chart representing the 2 minutes earlier