
R. H. CHAMBERS AND J. TAYLOR
Introduction
It has been known for some time that a difference between observed and theoretical phase of Venus is apparent, not only at dichotomy (Schröter’s Effect) but throughout the planet’s cycle. Warner [1] has shown that the magnitude of this difference varies according to the phase of the planet, being ± 10%, near 10% and 90% illumination.
There has been considerable speculation whether this effect is due to conditions on the planet itself or to observing errors. Agreement between individuals at any one elongation is poor but most observers are convinced of the reality of the phenomenon, although Cattermole et al..[2] have pointed out the difficulties in obtaining consistent and accurate results when known standards are available for comparison.
Experimental Programme
As most measurements have been made from drawings of the planet plus a few micrometer observations, it was considered that a different approach to the problem would be of value. Accordingly, it was decided to use a calibrated model as a standard for comparison with Venus in the optical train of the telescope. The study was divided into three separate experiments:
1. With one model alone. To make drawings and compare the measurements of phase from these drawings with the known phase of the model.
2. With two models. Using one model as a fixed standard, to vary the other until it matched the phase of the first and to record any difference.
3. With one model. Arranging for the model to be seen in the same field of view as Venus and varying the model to match the planet’s phase.
It will be seen that experiment I was a check on the normal methods of ascertaining the phase of Venus and experiment 2, a necessary precursor to experiment 3 was designed to assess how accurately one object could be matched to another.
Twenty three people took part in experiment I and twenty one in experiment 2. Experiment 3 is still under consideration but the results so far obtained are thought to be of sufficient interest to warrant publication before the study is complete.
Experiment I
Apparatus
- One elbow telescope on altazimuth mounting;
- One identification telescope on altazimuth mounting;
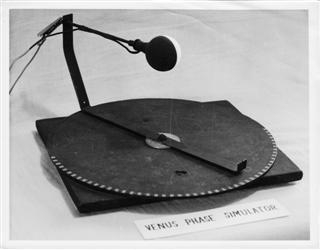
- One Venus phase simulator (V.P.S.), shown in figure 1.
The V.P.S. consisted of a table tennis ball painted black on half of the sphere, illuminated from within by a flash light bulb and suitably mounted over a platform containing a scale of divisions giving an accurate measurement of phase. The sphere assembly could be rotated and the simulated phase read off the scale. A sighting device was incorporated to facilitate the accurate alignment of the V.P.S. with the observer.
Method of use
The two telescopes were set up about twelve yards from the V.P.S. and carefully lined up with it, the identification telescope being above and behind the elbow telescope so that observations could be conducted simultaneously from both instruments.
Each observer was issued with a sheet of paper on which was drawn a circle of approximately five inches diameter. During the course of the experiment the V.P.S. was set at a number of known phase angles and each observer
sketched on the paper the phase as seen through the telescopes. The experiment was carried out with the V.P.S. in the dark and without the observer having knowledge of the setting value

A total of 240 observations were recorded from 23 different observers. These are shown in Table I and in graphical form in Figure 2, where the standard deviation of each set of figures is also plotted. No apparent difference was recorded between the estimates from the two telescopes.
Experiment 2
Apparatus
- One elbow telescope on altazimuth mounting; Two Venus phase simulators
Method of use
The two simulators were set up twelve yards from the telescope with the axes of the spheres in the same vertical plane so that through the telescope one sphere appeared above the other. The first V.P.S. was set at a particular phase and the other was varied by an operator under instructions from the observer looking through the telescope. When the observer considered the two images were matched, the setting of the second V.P.S. was noted by the operator. The experiment was carried out in the dark.
Results
A total of 21 observers gave 63 observations. These are tabulated in Table 2 and shown in graphical form in Figure 3, where the standard deviations are also plotted.
Discussion and Conclusions
Examination of Figure 2 reveals that the differences between the observed and actual phases of the model Venus follow a regular pattern, being highly positive at phases in the order of 3o per cent and negative at phases around 70%. Reference to Figure 2 of Warner’s paper,’ where a large number of actual measurements of the planet has been plotted, shows a similar variation with phase. It is true that at 50 % phase Warner shows a positive (O–C) in contrast to the negative (O–C) in Figure 2, but the magnitude of this difference is not great, and it must be remembered that the experiments described in this paper were carried out under ideal conditions, which makes it hardly surprising that minor differences in detail should result. What is of greater importance is the close similarity between the two curves which points to a common origin for both sets of data. It is difficult to draw any other conclusion than that the causal factor lies in the observer and the dif¬ferences between the observed and theoretical phases of Venus are of physiological origin.
Attention is also drawn to the increased scatter of results at high and low percentage illumination, indicating the difficulty of the observation and the imprecise nature of any values obtained.
Although the data obtained in experiment 2 are not extensive, they do point to the conclusion that a comparison can be made between two images that is of sufficient accuracy for the purpose. It is intended that further confirmatory experiments will be carried out before the final phase of the study is completed.
Acknowledgments
Thanks are due to Mr J. Wright who constructed one of the Venus phase simulators, and to members of the Crayford Manor House Astronomical Society who took part in the experiments with such enthusiasm.
References
I Warner, B., J.B.A.A., 73, 65.
2 Cattermole, P. J., Nicholson, I. and Moore, P., J.B.A.A., 73, 118.