Frequency: 20-25kHz (VLF)
Cost: zero to ~£200 depending on approach used
Area of Study: Solar activity
Difficulty: Easy
Theory for those in a rush:
• The Earth’s ionosphere changes depending on the amount of radiation and particles from the Sun that interact with it.
• Very Low Frequency radio waves from military transmitters on the Earth reflect off of the ionosphere, interfering with the wave received directly from the transmitter, resulting in a change to the signal levels received.
• When solar activity is high, ‘clumps’ of solar wind hit the ionosphere and disrupt it resulting in sudden changes to the signal level received, thus an indirect measure of solar activity is possible.
There are two general methods for observing SIDs.
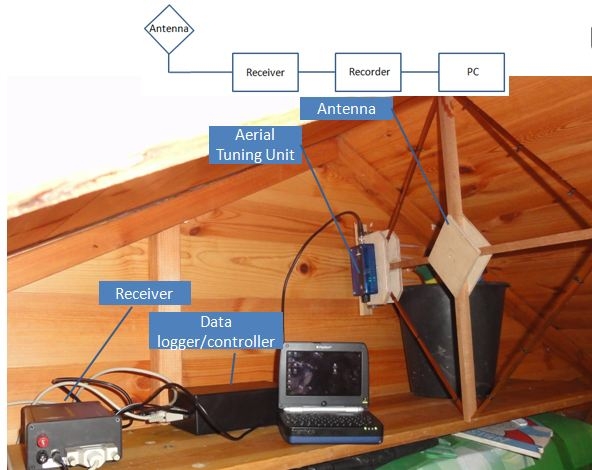
Method 1:
Dedicated radio receiver
In this set-up you build/buy
- a loop aerial
- receiver
- data logger
You then tune the receiver to a specific transmitter frequency, then monitor the signal strength with a data logger.
Advantages
Low power consumption, you can leave and recover data at a later date, it is Low noise and UKRAA offer kits and fully built units.
Disadvantages
Ideally you want to capture more than one frequency and this will require multiplying up on equipment. More expensive than Method 2!
UKRAA (a registered not for profit charity) design and build a VLF set-up, Members Simon Dawes has one of these, they are well built, and have a very high level of support, building is straightforward.
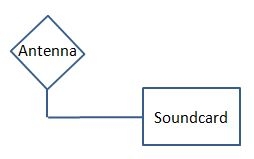
Method 2:
PC sound card and loop aerial
The frequency of VLF radio stations coincides with the frequency of sound, but sound comes from air pressure waves rather than electromagnetic waves, a microphone converts these sound pressure waves into electrical signals, so by replacing the microphone with a loop of wire that converts the magnetic component of the EM wave to an electrical signal you can ‘listen’ to the electromagnetic waves and use spectrum analyser software to determine the frequencies with the most power.
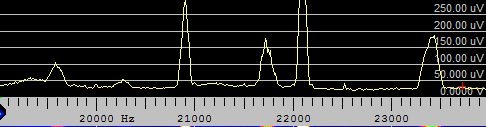
Part of Spectrum Lab showing the power of a signal at different frequencies.
So in this set-up you build a loop aerial, I have had success with a 600mm diameter loop with 25 turns, others have used 2m length of scart cable by wiring the cables ends together to give one continuous wire that loops around many times, then plug it into the microphone input of your PC’s sound card (warning you should include some protection for the sound card as it could be possible to kill your PC), run a FFT analysis program such as the freeware Spectrum Lab and measure the power at the frequencies you are interested in, using the software’s built in plotter/logger program.
SpectrumLab can be set-up to monitor the signal strength at specific frequencies, and although a complex program, it is easy to use. A really quick way to get started is to use my configuration file SETTINGS.INI add this file to the Spectrum directory and you will be set to monitor VLF stations with some optimal settings for SIDs, these settings were actually provided by a member of the BAARAG forums and I have modified to suit my needs.
An ideal PC to use would be an old laptop, these are low power and can be picked up for next to nothing, mine is a Windows 95 first Edition, 256Mb memory, 400Mhz, Pentium 2 and this is more than capable of doing the job. A detailed description of the SpectrumLab set-up is available here – note my trusty laptop developed a squeak and died so I am currently only observing with the UKRAA receiver until I can work out how to replace the laptop with a Raspberry Pi.
Advantages
Practically zero cost
Leave and recover data later
Very easy to set-up
Monitor many stations at once
Disadvantages
You need a PC on full time.
Results
On a quite day you can expect to get a classic shape to your signal levels, the signal level changes are based on the changes to the ionosphere as it becomes excited by the Sun.
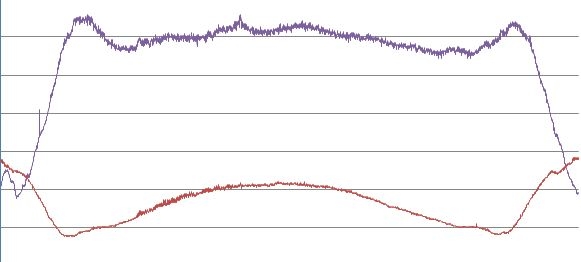
A SID has a classic shape, but where there are multiple events they can become complex, what is always apparent however is a rapid change in signal strength (signal can go up or down depending on if the interference is constructive or destructive)
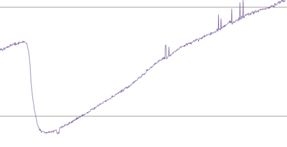
This is the ‘shark fin’ shape of a classic SID
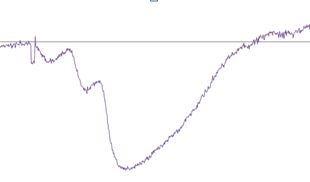
A more complex SID showing 3 superimposed on one another
Classification
SIDs are classified according to their duration and their general impact in the signal level will also indicate their size but these levels are specific to the observer, their equipment and the stations being monitored.
When reporting you need to report start, peak and end of event and the importance, which is based on the overall duration.
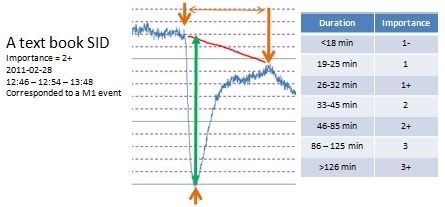
Classification of a SID
Reporting your observations to the BAARAG and the BAA solar section will help these interested parties learn more about the Sun, and if you monitor for long enough you will be able to produce your own chart of solar activity over the 11(22) year cycle.
Monitoring multiple frequencies helps to pinpoint smaller events and it is also possible to have events affect some stations and not others.
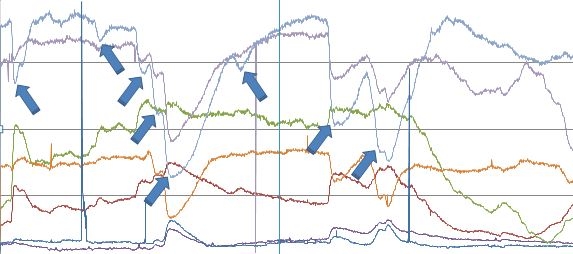
Monitoring multiple stations makes it easier to interpret results. Each line represents the signal strength of a VLF radio statio