Frequency: 20-150MHz (VHF)
Cost: ~£150 (antenna and radio receiver)
Area of Study: Meteor Showers, sporadic meteors (diurnal rate variation, annual rate variation).
Difficulty: Easy-Medium
The advantage of observing meteors with radio is that cloud and daylight don’t interfere. A radio set-up needn’t be expensive, budget about £150 if you are starting from scratch for a simple system.
Theory for those in a rush
VHF radio signals travel ‘line-of-sight’ so a transmitter over the horizon will generally not be receivable, however when meteoroids ‘burns up’ in the atmosphere they ionise the air around them creating a reflective surface that the signal from the distant transmitter can bounce off of and it is this signal we are trying to receive, this is called forward scatter.
It is generally accepted that best results are achieved from frequencies in the range of 30-100MHz, however commercial stations in this band are being turned off as part of the Europe wide digital switch over so I have chosen the GRAVES radar in France, this transmits at 143.050MHz and should be around for some time.
The antenna needs to be built for the radio frequency being observed, the design I have chosen is a Yagi, these are the same design as most TV aerials, and a design with a modest gain and only a few elements will provide a wide ‘field of view’, these can be bought commercially or can be made.
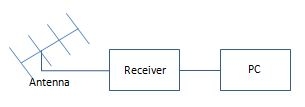
The radio scanner needs to be tuned just outside of the frequency required, mine is tuned to 143.049MHz and set to the upper side band (USB), this will result in a tone, rather than the actual signal being picked up when a meteor reflects the signal – more information on how this works can be found in ‘The Radio Sky and how to Observe It’ by Jeff Lashley.
The audio output from the receiver is passed into the soundcard of a PC and spectrum analyser software (Spectrum Lab) is used to identify and log the meteors.
Spectrum Lab set-up for Meteor Observing
Spectrum Lab comes with a basic scripting language, I have set this up to complete the following tasks for me.
- Measure peak signal, noise and frequency of peak signal in the band of frequencies I am interested in
- Test if the signal is strong enough to be a meteor
- complete two validation tests to help filter ‘spurious’ signals
- Log the meteor
- a file that lists the particulars for every meteor
- a file that logs the hourly meteor rate
- a file that logs the hourly meteor rate and a few other details
- Save an image of the waterfall with the meteor on
- Save the audio that contains the meteor
- Save an image of the plotter showing the signal level, noise and trigger level
- Mark the waterfall with the meteors details
- Periodically take an image of the waterfall so that I have 24Hrs coverage (I use this during testing)
I also use Spectrum Lab to continually record the signal strength, noise and trigger level to a CSV file.
The main script (points 1-7 above) uses Spectrum Lab’s ‘conditional actions’ and this is explained below, I also configure Spectrum Labs buttons to toggle functions within the script
Conditional Actions for Spectrum Lab
I have created a file for my script to load this file into spectrum lab click on File|Conditional actions then click on the Load button
Below is a detailed description of the conditional action script which you might find useful when debugging your set-up
Variables used in the script
SIG=Current measured signal value
NOI=Current noise value
A0,A1,A2,A3,A4,A5 = temp stores for noise value
M_DUR= duration of current meteor in spectrum lab cycles, if M_DUR =1 then this is a new meteor
TOTAL_DUR = total duration of all meteors for the hour
COUNT_HR = Hourly meteor count
M_MS = holds mmss of last test
M_HR = current hour of last test
M_TIM = time meteor first detected, this is stored for use in file names etc.
M_SIG = the signal strength that triggered the meteor
M_FRQ = the Frequency that triggered the meteor
M_NOI = the noise when the meteor was triggered
MAX_DUR = holds the longest duration for the whole hour
M_YMD = date in YYYYMMDD format
TEST_A = holds the result of a test to assess if this is a meteor
TEST_B = holds the results of a test to decide if this is a meteor
Switches & Flags used in the script (variables that are either on or off)
RUN = used to tell the script to start recording, this prevents false meteors on start up
CHK = used to flag that a suspect meteor signal has been found
FLAG_A = 1 if test A passes
FLAG_B = 1 if test B passes
Log_WAV = ON if periodic wav files are required (this uses loads of disk space so default is off, I use for debugging and during showers so I have a manual check
log_PLOTpic = ON if a picture of the plot if captured, default is off as I found this not so useful
FLAG_TIME = flag to ensure RMOB files are only written once per hour
Parameters (variables that are set once by the user when first setting up spectrum lab)
THRESHOLD = parameter that is used to define how much above the noise the signal needs to be to be considered a suspect meteor
DIR = Holds the directory where the logged data will be held
M_NAM=used to record file name for WAV and JPG files
LOW = lowest frequency to monitor
HIGH = highest frequency to monitor
VERSION = holds the version number
Constants
ON = 1 used for controlling switches to turn on functions makes the script a little easier to read
OFF = 0 used for controlling switches to turn off functions makes the script a little easier to read
Timers (internal timers used by SpectrumLab to complete periodic actions)
Timer0 = 2s; used to check the meteor has ended, i.e if the meteor can have a gap of up to 2s and still be counted as a single meteor
Timer1 = 15s; used to wait 15s after the meteor ends so the image will not be right at the top of the page when the waterfall is saved
Timer2 = 5s; used to trigger the end of the wav file 5s after the meteor ends
Timer3 = 2s; used to print the meteor details
Timer4 = 10s; used to prevent meteors being detected in the first 10s of the script running this is to allow Spectrum Lab to settle down
Script
First set the constants and declare all the variables and parameters used
01 if( (initialising) ) then ON=1: OFF=0: VERSION=”2012-06-09″
You can edit THRESHOLD=20 to any value to suit your equipment, this is the level above the measured noise that the signal needs to be to be considered a suspect meteor
02 if( (never) ) then REM Threshold = difference that triggers meteor check,
03 if( (initialising) ) then THRESHOLD=20:LOW=1740:HIGH=2780
DIR is the folder where you want to store the files/logs created, makes sure you have this created first.
M_NAM is the prefix that all log files will have
04 if( (never) ) then REM DIR = folder to store logs; M_NAM = prefix name for meteor files
05 if( (initialising) ) then DIR=”c:\\spectrum\\meteorlog\\”:M_NAM=”Meteor”
06 if( (never) ) then REM log_WAV = turns .wav file logging on & off; log_PLOTpic turns save of the plotter on & off
The default when the script starts is to not save a WAV file or capture a screenshot of the plotter window when a meteor is identified, you can change these to ON if you prefer the default to be ON, These parameters are also controlled by the Spectrum Lab buttons which toggle these logging options on and off (see later section)
07 if( (initialising) ) then log_WAV=OFF:log_PLOTpic=OFF
08 if( (never) ) then REM NOI=noise, SIG=Signal
09 if( (initialising) ) then NOI=0:SIG=0:TOTAL_DUR=0:COUNT_HR=0:FLAG_TIME=0:MAX_DUR=0:T1=0:
10 if( (never) ) then REM RUN = switch, starts turned off and prevents meteors from being measured until timer 4 expires FLAG_TIME
11 if( (never) ) then REM CHK = switch, if SIG>NOI+THRESHOLD then turn on and check for meteor
RUN is used as a switch it is in the OFF state when the script first runs to give SpectrumLab a chance to settle down, it is turned on when Timer4 expires, timer4 is set to expire in 10 seconds
12 if( (initialising) ) then RUN=OFF:CHK=OFF: TST=OFF
13 if( (never) ) then REM M_ = possible Meteor ; M_TIM=time ; M_SIG=Signal; M_FRQ=Frequency; M_NOI=noise; M_DUR=duration in cycles
14 if( (never) ) then REM M_YMD= date in YYYYMMDD format; M_HR=hour; M_MS= minutes seconds in MMSS format
LOW and HIGH need to be set to the frequency band you want Spectrum Lab to monitor, this will depend on local noise and your receiving equipment
15 if( (initialising) ) then M_TIM=0:M_SIG=0:M_FRQ=0:M_NOI=0:M_DUR=0:M_YMD=””:M_HR=””:M_MS=””
16 if( (never) ) then REM A# = temp noise values used to provide a rolling average for the noise
17 if( (initialising) ) then A0=0:A1=0:A2=0:A3=0:A4=0:A5=0
Change the value 10 to change how long after the script is started before meteors begin to be counted, I found I needed this to prevent a meteor being recorded whenever I started the script
18 if( (initialising) ) then timer4.start(10)
19 if( (initialising) ) then FLAG_A=0: FLAG_B=0 :TEST_A=10:TEST_B=0
Once Timer4 has expired the logging of meteors will begin, this line writes onto the waterfall some text to let you know that the automatic logging has started
20 if( (timer4.expired(1)) ) then RUN=ON:sp.print(“Let’s find some Meteors! By Simon Dawes Version:”+VERSION):NOI=noise(LOW,HIGH)
The next two lines manage the measurement of noise, I run a 6 point running average on the noise meauserment, i.e the last 6 noise measurements are stored and averaged to give a value that is stored in NOI that is used in the subsequent tests
21 if( (always) ) then A5=A4:A4=A3:A3=A2:A2=A1:A1=A0:A0=noise(LOW,HIGH)
22 if( (always) ) then NOI=(A0+A1+A2+A3+A4+A5)/6:SIG=peak_a(LOW,HIGH)
the next line stores the current date and time
23 if( (always) ) then M_YMD=str(“YYYYMMDD”,now):M_HR=str(“hh”,now):M_MS=str(“mmss”,now)
This line checks to see if the signal has breached a THRESHOLD above the noise (NOI), if it has CHK=ON and additional test will be performed to try and distinguish between meteors and other signals (this sort of works for me, but might not work for you, you can adjust the sensitivity of these tests – on lines 29 and 30) it will only do this then the suspect meteor is first detected
24 if( ((M_DUR=0)&(SIG>(NOI+THRESHOLD))&(RUN=ON)) ) then CHK=ON
If line 22 is not true then turn off the secondary meteor checks
25 if( (else) ) then CHK=OFF
Take some measurements of the suspect meteor
26 if( ((CHK=ON)&(SIG>(NOI+THRESHOLD))) ) then M_TIM=M_YMD+” “+M_HR+M_MS:M_NAM=”Meteor”+M_YMD+M_HR+M_MS:M_SIG=SIG: M_FRQ=peak_f(LOW,HIGH):M_NOI=NOI
I now take some measurements that will be used to confirm this is a meteor, TEST_B (sigma) measures the standard deviation in a band 20Hz wide centred on the peak frequency, if the standard deviation is low the the signal levels across this band are not varying much, this (for me at least) is a good indicator of a meteor. TEST_A is just a spot check a few hertz below the peak frequency to see if the value is much different, again for a meteor I have found this should not vary much. These are empirical tests rather than text book definitions, they may have little basis but seem to help weed out other signals.
27 if( (CHK=ON) ) then TEST_B=sigma(M_FRQ-10,M_FRQ+10):TEST_A=sqrt((peak_a(M_FRQ-10,M_FRQ-5)-M_SIG)^2)
Lines 26, 27 and 28 are not needed and can deleted
28 if( (never) ) then REM ——— Next line is for test only ———
29 if( ((CHK=ON)&(TST=ON)) ) then sp.print(“A”+str(TEST_A)+” B”+str(TEST_B)):TST=TST+1
if( (else) ) then TST=OFF
30 if( (never) ) then REM ——- previous line is for test only ——-
Lines 31 & 32 control the thresholds for the secondary meteor tests, these should be set at the commissioning stage until you get a reasonable correlation between what you think is a meteor and what is detected, when commissioning start with high values, or if you don’t want these secondary tests replace simply delete the ‘&(TEST_………)’ so that if CHK is on the FLAG_A and FLAG_B are always set.
31 if( ((CHK=ON)&(TEST_A<6)) ) then FLAG_A=1
32 if( ((CHK=ON)&(TEST_B<7)) ) then FLAG_B=1
If line 33 is true then all conditions for a deciding this is a meteor are satisfied, so the timers are reset, this ensures that the meteor has finished before it is logged, otherwise you can get multiple logs for a single meteor, the disadvantage of this is you might count multiple meteors as a single meteor, so the values in the brackets will always be a compromise.
The meteor duration will increment (the duration is in cycles, i.e the time SL takes to complete one pass of the script, I have yet to calibrate this to seconds),
33 if( ((FLAG_A=1)&(FLAG_B=1)&(RUN=ON)&(SIG>(NOI+THRESHOLD))) ) then M_DUR=M_DUR+1:TOTAL_DUR=TOTAL_DUR+1:timer1.restart(15):timer2.
(5):timer3.restart(2):timer0.restart(2)
if saving of WAV files is ON then the name of the wav file is set and the recording begins, note the recording will have a ‘lead-in’ and ‘lead-out’ time the ‘lead-in’ is set in the main options is spectrum lab, and ‘lead-out’ by timer2. I have these set to 5s each.
34 if( ((M_DUR=1)&(log_WAV=ON)) ) then rec.filename=DIR+M_NAM+”.wav”
35 if( ((M_DUR=1)&(log_WAV=ON)) ) then rec.trigger=1
I store the duration of the longest meteor per hour in MAX_DUR this is used in the DMOB files
36 if( (M_DUR>MAX_DUR) ) then MAX_DUR=M_DUR
Here we have the user notification/logging section of the script, they are all controlled by the various timers timing out.
37 if( (never) ) then REM ———– Notify User of Meteor ————
When timer0 expires the meteor has ended, so the meteor count per hour is incremented and the details of the individual meteor is stored in the meteor log file, this if cunningly changes name once per month.
38 if( (timer0.expired(1)) ) then COUNT_HR=COUNT_HR+1:fopen2(DIR+”MeteorLog-“+str(“YYYYMM”,now)+”.dat”,a):fp2(M_TIM+”,”+str(M_SIG)+”,”+str(M_NOI)+”,”+str(M_FRQ)+”,”+str(M_DUR)):fclose2
When timer3 expires I print the details on the waterfall screen to provide the user feedback, currently as I am still tweaking the script I record more information than is really necessary, I set-up the waterfall screen so that the LOW frequency is in the middle of the screen so the text I write over it doesn’t obscure the too much. The meteor duration is then reset to zero.
39 if( (timer3.expired(1)) ) then sp.print(M_TIM,”S=”,M_SIG,”dBm N=”,M_NOI,”dBm F=”,M_FRQ,”Hz t=”,M_DUR,” S:N=”,M_SIG-M_NOI,”Test:”,TEST_A,TEST_B):M_DUR=0
When timer2 expires I stop the WAV file recording
40 if( (timer2.expired(1)) ) then rec.trigger=0 :REM ———— stop the sound recorder ————
When timer1 expires I take a picture of the waterfall and if logging of the plotter is enabled then I also take a picture of this
41 if( (timer1.expired(1)) ) then capture(DIR+M_NAM+”.jpg”,100):T1=1
42 if( ((T1=1)&(log_PLOTpic=ON)) ) then plot.capture(DIR+M_NAM+”Plot.jpg”,100):T1=0
When the time reaches HH:59 and 55 seconds we store the hourly report for the RMOB file, and print a summary on the waterfall. I am still messing about with the script so haven’t got round to sending any files to the RMOB group yet!
43 if( (val(M_MS,”####”)=5955) ) then FLAG_TIME=FLAG_TIME+1
44 if( (FLAG_TIME=1) ) then fopen3(DIR+”RMOB_Dur-“+str(“YYYYMM”,now)+”.dat”,a): fp3(M_YMD+M_HR,”,”,M_HR,”,”,COUNT_HR,”,”,TOTAL_DUR,”,”,MAX_DUR,”,”,NOI):fclose3:fopen4(DIR+”RMOB-“+str(“YYYYMM”,now)+”.dat”,a):fp4(M_YMD+M_HR,”,”,M_HR,”,”,COUNT_HR):fclose4
45 if( (FLAG_TIME=1) ) then sp.print(“Last hour=”+str(COUNT_HR)+” Meteor(s) | Total duration “+str(TOTAL_DUR)):M_DUR=0:COUNT_HR=0:MAX_DUR=0:TOTAL_DUR=0
When the time reaches HH:00 and 00 seconds I reset the FLAG_TIME flag ready for the end of the new hour
46 if( ( val(M_MS,”####”)=0000 ) ) then FLAG_TIME=0
If the meteor duration is set to 0 (see line 37) the I reset the test flags & variables.
47 if( (M_DUR=0) ) then FLAG_A=0:FLAG_B=0:M_SIG=0:M_NOI=0:M_FRQ=0
Controlling the script from the Spectrum Lab buttons
The buttons in Spectrum Lab are very useful for outputting information and triggering events, I use them to provide output from my script and some control of the switches in the script. To edit the buttons you right click on them.
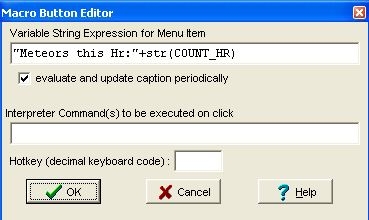
Meteors per hour
This displays in a button how many meteors there have been in the current hour.
clicking the button has no effect
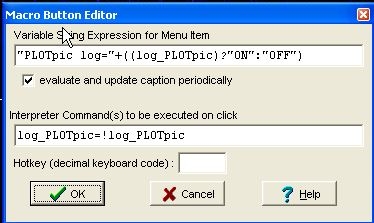
This button tells you the current state of the plotter log (this is the log file that saves the plotter screen if a meteor is detected)
clicking the button toggles the saving of plotter files on or off
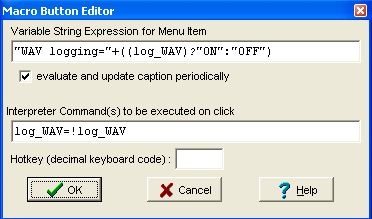
This button tells you the current state of the wav log (this is the log file that saves a wav file if a meteor is detected)
clicking the button toggles the saving of wav files on or off
Summary of files output by the script
For each meteor
- MeteorYYYYMMDDhhmmss.jpg – image of the waterfall 60s after the meteor ended, the waterfall has a vertical scale of 5 minutes.
- MeteorYYYYMMDDhhmmss.wav – audio file starting 5s before the meteor and finishing 10s later, note for meteors in quick succession these might be in a single file.
- MeteorYYYYMMDDhhmmssPlot.jpg – image of the plotter 60s after the meteor ended, the plotter has a horizontal scale of 5 minutes.
- Update of file called MeteorLog-YYYYMM.dat this is a monthly file, each line of this file contains the following…
- Time meteor detected (YYYYMMDD hhmmss)
- signal strength that triggered meteor
- Noise level when meteor triggered
- Frequency of trigger event
- duration in ‘cycles’
On the hour
- RMOB_Dur-YYYYMM.dat this is a ‘Radio Meteor Observing Bulletin’ file see www.rmob.org it is a monthly file and stores the following
- Current hour (YYYYMMDDhh)
- hour (hh)
- meteors detected in the hour
- the total duration of all meteors detected in the hour in ‘cycles’
- the duration of the longest meteor in the hour
- the Noise measured at 59:55 i.e. 5 seconds before the end of the hour.
Each hour this file is updated with the last hours data.
- RMOB-YYYYMM.dat this holds a subset of the data in the other file…
- Current hour (YYYYMMDDhh)
- hour (hh)
- meteors detected in the hour.
Each hour this files is updated with the last hours data.
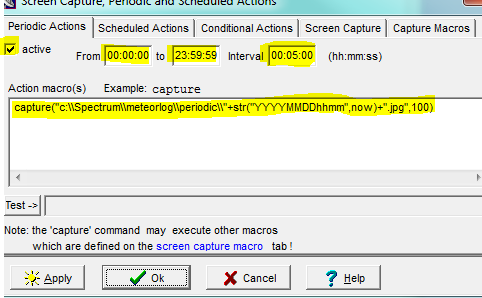
Periodic actions
I take an image of the waterfall every 5 minutes , this is also the period displayed by the waterfall so I have images for the whole period.
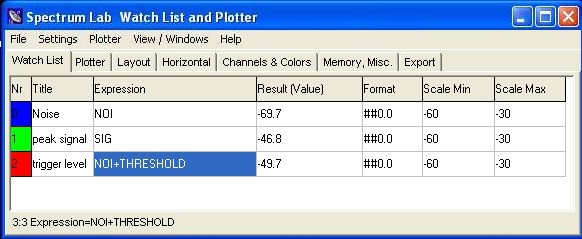
Plotter
I also monitor everything with the built-in plotter, note it is plotting variables from the script rather than direct values.